Discover Our Blog
Stay up to date with the latest marketing, sales, and service tips and news.
Dashboards are essential for high-level management and views into your business and the KPIs that matter to you. Since everyone looks at different metrics, we made dashboards fully customizable with a simple drag and drop interface.
Create multiple workspaces for any imaginable scenarios!
Use any of the 3 Preset tabs or customize a Blank template for your specific needs.
Overview
This will show multiple widgets containing mainly your sales, income, costs, and orders data.
PPC
Compare
P&Ls PPC Highest margin, best products
All widgets can be adjusted in size, moved around, and are totally customizable so you can set your desired dashboard view.

You can lock the data for every widget to 1 or more specific seller account(s).
Normally, the data of the widget is grouped by the selected seller accounts at the top.

Select a preset time range. The graph or card will update and show the corresponding data. (The date range selector at the top won’t affect the widgets locked by a time range.)

Choose the type of graphic you feel most comfortable with; lines, bars, or both.
Use the granularity feature to group the data for daily, monthly, yearly, or quarterly reporting!

The Sales Breakdown graph contains a profit and loss statement that describes in detail your Revenue, Sales, Fees, Promotions, Taxes, Shipping, Gift Wrap, Refunds, COGS, and Advertising costs.

You can also export this file.

Check your daily sales statistics at a product level within the Seller Accounts enabled.

Column Suggestions
‣ Most Profitable, less profitable products
‣ PPC Spent VS PPC sales, change the focus of your campaigns!
‣Organic sales VS PPC sales
‣Products with the most refunds for customer follow-up or product feedback.
‣Top decisions for products and campaigns.
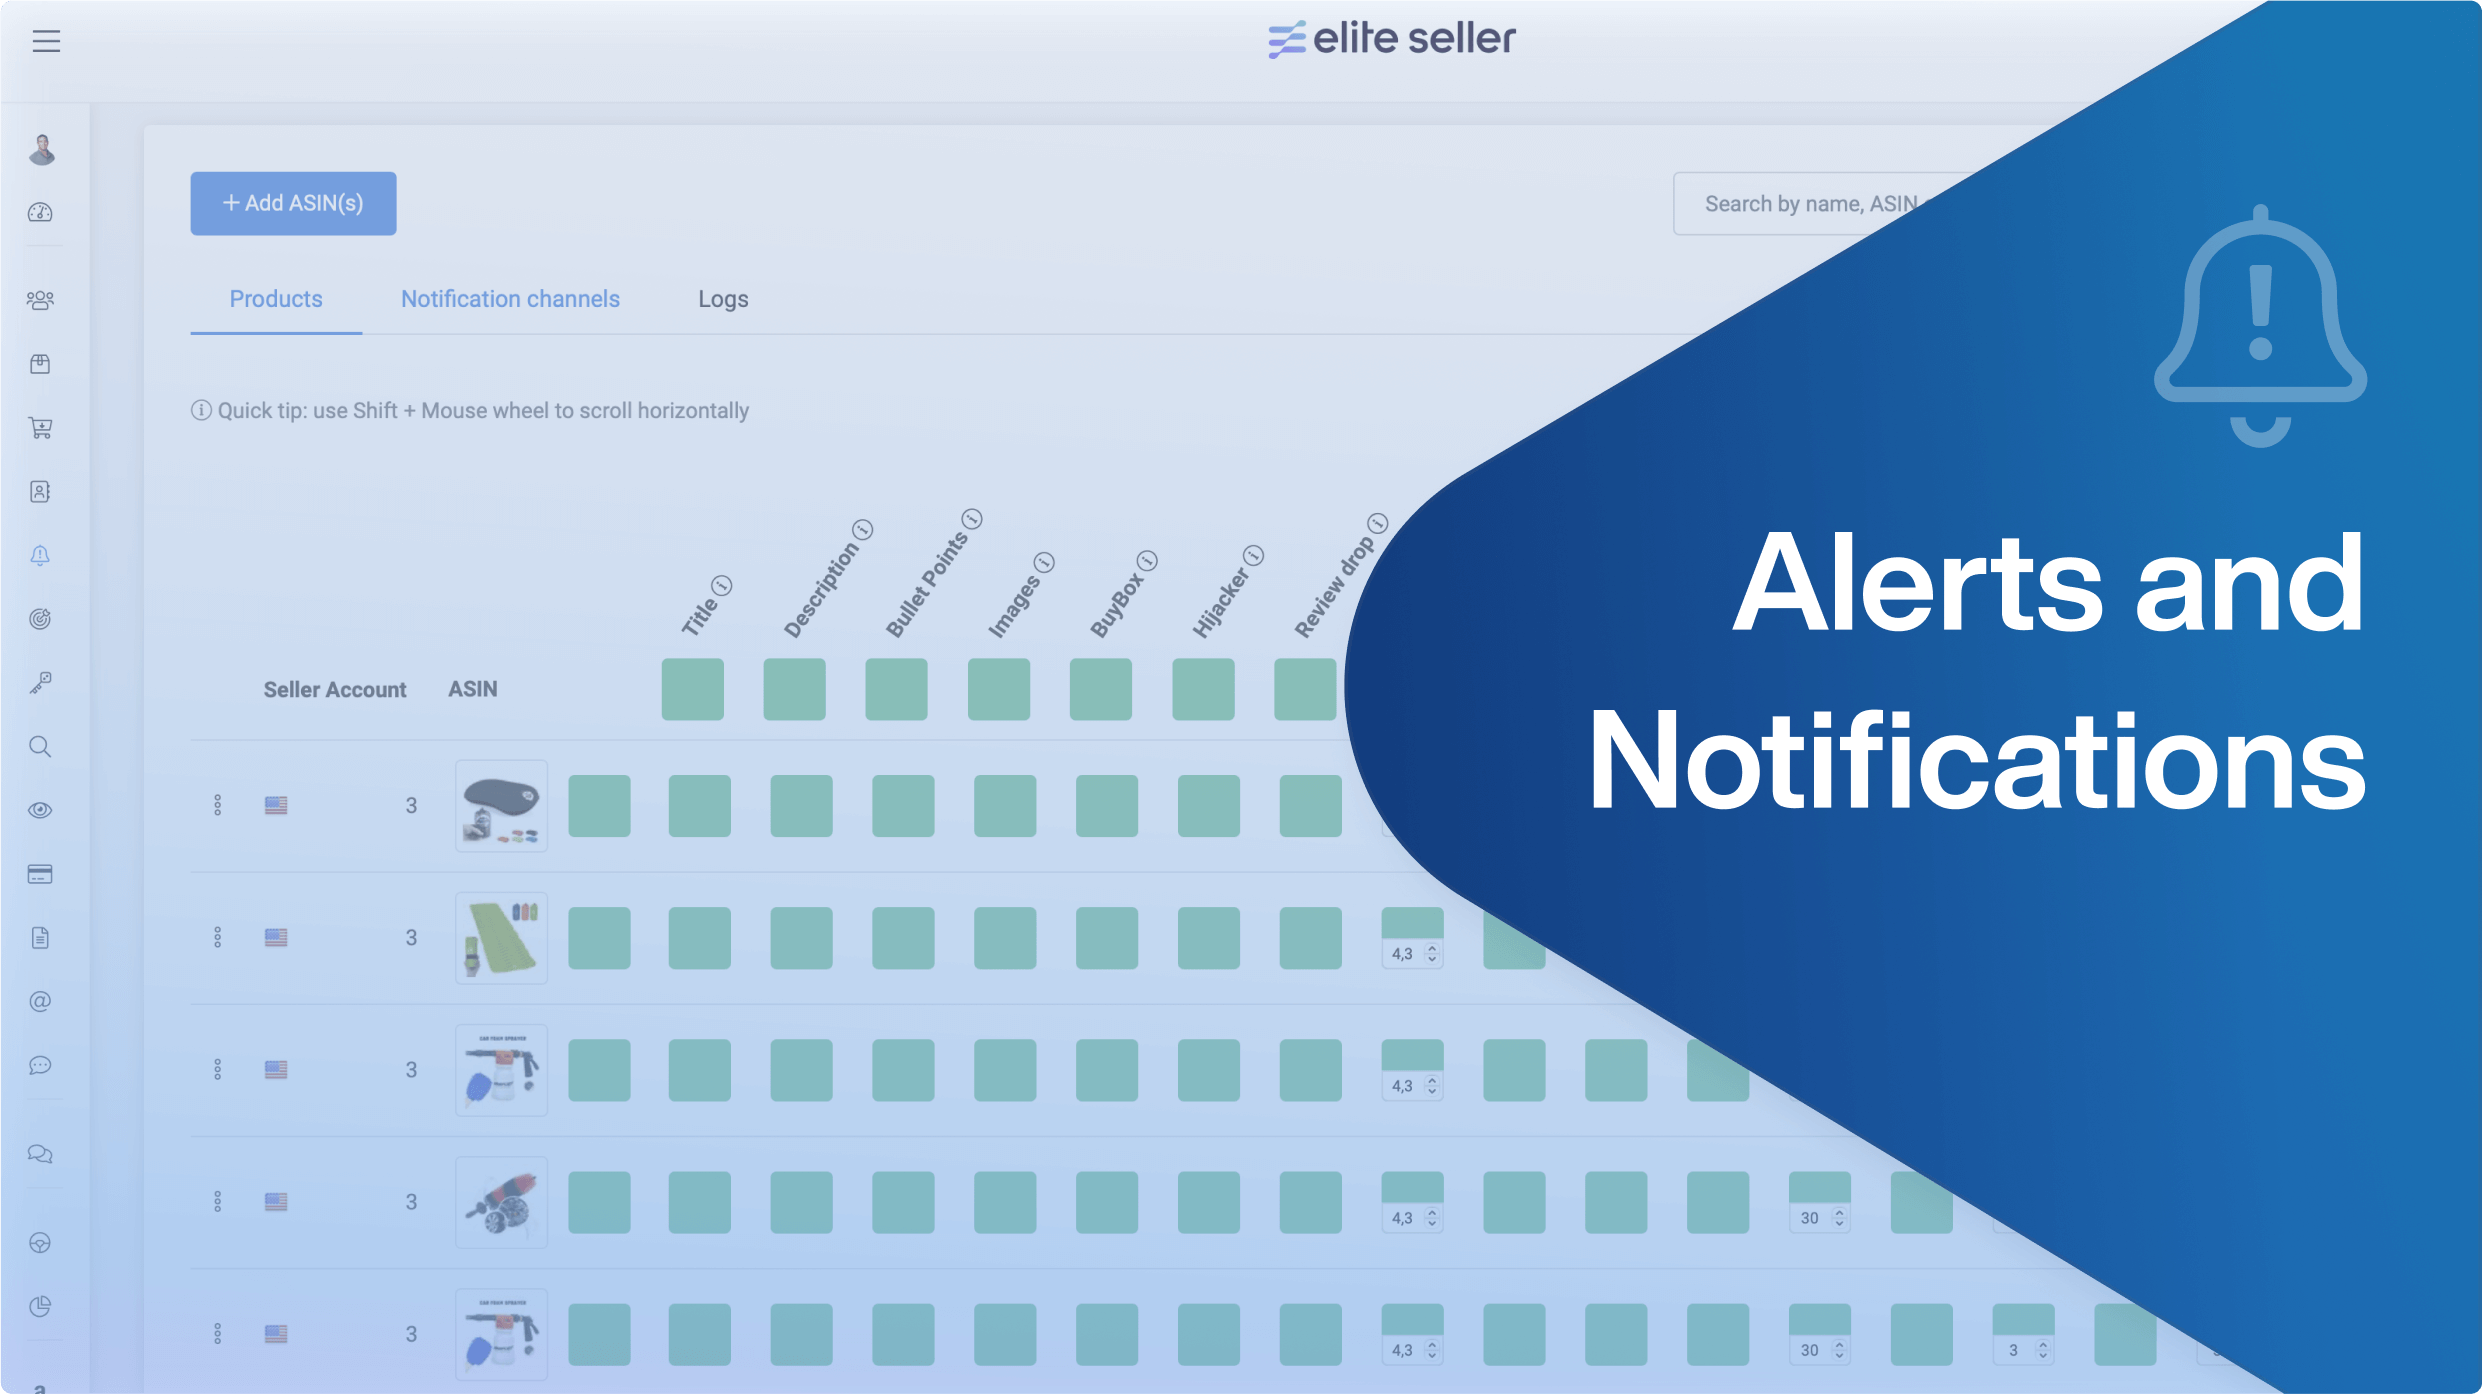
Want to have a quicker way to see the Alerts Logs? Now you can add them to the Dashboard as a widget!

If you have the auto-tracker feature enabled in your Keyword Tracker settings, now you can see the auto-tracker feed in your dashboard to check the new ASINs that are being tracked, the keywords changes, and the keywords that were removed from the tracker.
With the auto-tracker, we start tracking new ASINs based on their recent sales and add/remove the ranking Keywords for you.
